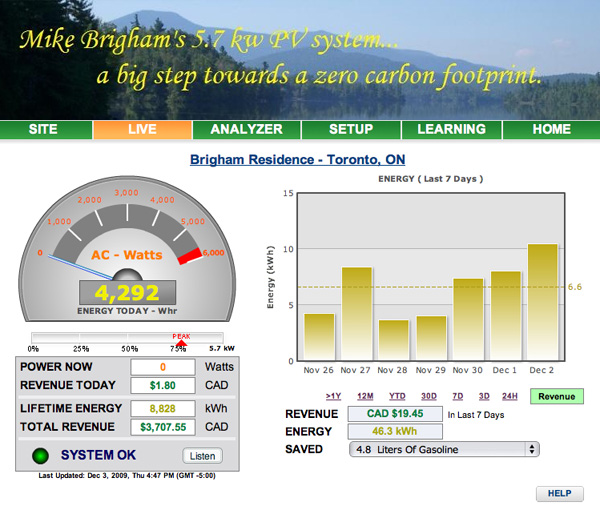
Real Time Reporting on Real World Solar System Performance
Getting the most from your solar investment starts with knowing what real systems
are producing in Ontario. Check out these results from Our Power residential members.
|
|
|
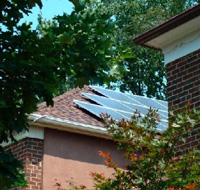
Debra Anthony Residence
2.5 KW system Day4 panels
2009 Production
Total - 2905 kwh
Per kilowatt - 1139 kwh
|
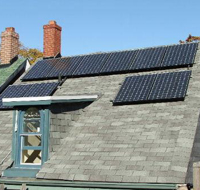
Sue Dexter Residence
3.0 KW system Sanyo panels
2009 Production
Total - 3380 kwh
Per kilowatt - 1127 kwh
|
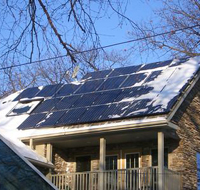
Mike Brigham Residence
5.68 KW system Day4 &
Sanyo panels
2009 Production
Total - 6190
Per kilowatt - 1090 kwh
|
Benchmark Numbers from a Public School

Rawlinson Public School in West Toronto has a 1 KW system installed as an awning
on the school with excellent, un-shaded, well-aligned solar exposure. The 2009 system
produced 1160 kwh.
Working with Our Power gets you far more than just receiving an optimistic computer
analysis based on questionable assumptions.
Become a member, get your solar site assessment
and join the solar revolution today!
Solar Potential Across Ontario (per installed kW)
| City |
kWh/year |
| Thunder Bay |
1226 |
| Sault Saint Marie |
1151 |
| Ottawa |
1198 |
| Kingston |
1193 |
| Toronto |
1161 |
| Niagara Falls |
1151 |
| London |
1152 |
| Windsor |
1209 |
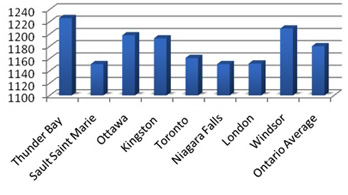
Source: Natural Resources Canada, PV Potential and Solar Resource Maps of Canada
How Your Power Gets to the Grid

Sun hits the solar panels on your south-facing roof generating Direct Current (DC)
electricity that flows to your inverter, which converts it to Alternating Current
(AC) electricity for export through an export meter to the electrical grid. You
receive 80.2 cents for every kwh you produce, and you buy electricity from the grid
through your import meter for use in your home at the going electricity rate. The
Our Power Wiki provides further more detailed information.
And you'll have a choice of cool online meters to show you all the money you are
saving!
